

Private debt has seen extraordinary growth in recent years, growing four-fold over the last decade and 60% since 2020[1]. This rapid growth has led reporters and market participants to crown a ‘Golden Age’ for private debt. Part of the asset class’s rise stems from its increased prominence, with non-bank lenders taking market share from traditional banks in lending to small and mid-sized companies due to ever-tighter banking regulations following the 2008 Financial Crisis. But another part is the recent, uniquely attractive opportunity set for the asset class driven by the post-Covid sea change in central banking policy.
On March 17, 2022, the Federal Reserve increased the federal funds rate for the first time since December 20, 2018, marking the beginning of an interest rate hiking cycle that has played out over the last two years before the recent pause. Investors have needed to assess the impact of the new rate environment across different asset classes to make informed decisions on investment strategies. Today, we’ll explore the impact that higher rates have had on private debt – specifically, in direct lending – and look ahead to the effect declining rates could have on the asset class.
Private Debt Overview
Private debt, defined simply as lending to companies by non-bank institutions, has grown significantly since the global financial crisis. By late last year, private debt as an asset class had grown to $1.6 trillion, from under $1.0 billion in 2020, and is forecast to grow to the high-$2 trillion range by 2028[1].

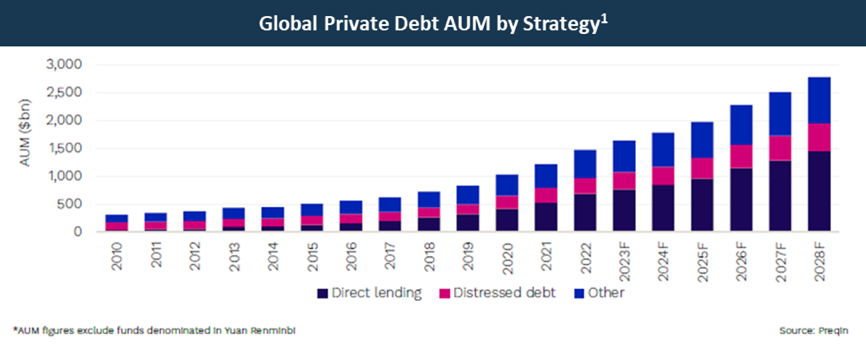
Direct lending, which represents roughly half of the private debt market, is one of the many varieties of private debt alongside mezzanine lending, distressed lending, and special situations, amongst others. Direct lending closely resembles traditional bank lending, where the lender invests in the senior-most part of the borrower’s capital structure and often obtains lender protection in the form of financial covenants. A key structural feature of the asset class is its floating-rate nature, with most loans priced as a spread over a risk-free benchmark rate. This combination of features provides investors with interest rate protection while maintaining a defensive position, all within their fixed income allocation.
The asset class has historically benefitted from higher interest rate environments, and the latest interest rate hike cycle has been no different. There are four ways in which higher interest rates have impacted the asset class: higher yields, tighter coverage metrics, a shift in the quantum and type of deals being financed, and more conservative transaction structures. Together, these impacts led to the creation of a uniquely attractive opportunity set for direct lenders – what the market has crowned as a ‘Golden Age’ of private debt.
Higher Yields
Let’s begin with the headline impact: in an asset class where most loans are floating rates, the increase in rates has directly boosted yields. At the start of 2022, the target federal funds rate sat at 0.00 – 0.25%. SOFR – the Secured Overnight Financing Rate, a benchmark interest rate for dollar-denominated loans which replaced the London Interbank Offered Rate, or LIBOR – was a mere 0.05%, well below common interest rate floors of 0.75 – 1.00%. Two years and eleven rate hikes later, the federal funds rate is now 5.25 – 5.50%, and SOFR is north of 5.30%.[2] Due to the floating-rate nature of the asset class, these rate hikes have directly translated into higher yields.


To illustrate this point, a direct loan priced at SOFR + 5.50% would have yielded 6.25% in January 2022 (thanks to an interest rate floor of 0.75%). Today that same loan would yield almost 10.90%, a significant increase when considering the structural downside protections available in this asset class.
Thanks to higher interest rates, direct lending is now providing higher returns to fixed income investors. This benefit is unique within the broader fixed-income universe since the fixed-rate instruments that make up the bulk of the bond market see their valuations fall as interest rates rise.
Higher Interest Rate Burdens
Of course, there is no such thing as a free lunch. Higher interest rates have helped to generate increased yields in direct lending, but they also place pressure on borrowers in the form of higher required interest payments. This can create issues if the underlying businesses struggle to generate enough cash flow to make these higher payments.
As coverage metrics grow tighter, there is an increasing chance that borrowers may be unable to make payments, and default on their loan. Currently, default rates in the private debt space remain below the long-term average (2.5%, from Q4/19 to Q1/24), sitting at 1.6% over the last twelve months[3]. Historical data tells us that higher interest rate environments have a limited impact on direct lending default rates. The past two interest rate hiking cycles – June 2004 to June 2006 (+425bps to 5.25%) and December 2016 to December 2018 (+230bps to 2.40%) – saw default rates of 1.7%, below the then-long-term average of 2.0%[4],[5]. Actual realized losses, of course, were lower – most defaults see some portion of the loan (right around 50%, historically) recovered by lenders. Central banks typically embark on prolonged rate hike cycles when the economy has recovered from a downturn and is exhibiting strong fundamentals for growth. In these growth environments, many businesses tend not to be as significantly impacted by interest rate increases because they are able to grow and generate more cash flow to offset their higher interest payments.
This time, however, may be different. As of Q3 2023, the private debt market has an average interest coverage ratio of 1.5x. This is down from 2.1x in Q1 2022 before the current interest rate regime began.[6]


The decrease in average interest coverage may be due to several factors. First, the current interest rate hiking cycle has been sharper than the two historical periods under review, rising +550bps in under two years. Second, with rates having been held lower for longer, many businesses had higher leverage than in past cycles – with greater debt burdens relative to EBITDA, the current hike cycle has had a larger impact on interest coverage metrics. Whether this decline in interest coverage leads to higher default rates than previous cycles remains to be seen, but the structural protections of the asset class – notably seniority in the capital structure and financial covenants – remain a bulwark against losses in the event of a default.
Changing Deal Volumes and Types
Rising interest rates have also impacted deal volumes, both in terms of the number and type of deals. Private debt is increasingly the capital source of choice for leveraged buyouts (“LBOs”), the transaction type used by private equity funds that use debt to acquire portfolio companies.[7]


In the sponsor-backed direct lending market, which focuses on loans to companies owned by (or being acquired by) a private equity sponsor, deal volumes are driven by LBO activity. Since FY 2021, LBO volumes have fallen 24% by count and 46% by value as higher borrowing costs have made borrowing the debt to conduct a leveraged buyout more expensive.[8] On top of this, the increase in interest rates has created a gap in pricing expectations for buyers and sellers of companies. Private equity firms are still valuing their existing portfolio assets at historically high marks, while buyers of these assets may struggle to justify these valuations amid the higher interest rate environment.
As a result, new platform deals (which tend to be larger LBOs that require more leverage) have been especially hard hit, falling by roughly 43% from FY 2021 to FY 2023. Add-ons, meanwhile, have been relatively more resilient, down by just 31% over the same period.[9] The relative resilience of add-on transactions is due in part to their size: investors are more comfortable making smaller acquisitions to grow an existing platform, and private equity funds with dry powder available can avoid debt financing altogether by making all-equity offers to consummate these smaller deals if they so choose.


What does all this mean for private debt? The shift in the types of deals made by sponsors has led to a matching shift in the types of deals being financed by direct lenders. More loans are made to existing borrowers with whom lenders are already familiar in the form of smaller add-ons to those existing platforms. For a private equity sponsor, buying a new platform in this environment is challenging – in addition to the usual underwriting risks, sponsors face challenges on ‘LBO math’ due to higher interest rates, creating pressure on potential returns. As a result, sponsors have preferred to deploy capital into growing ‘known assets’ already in their portfolios. The same logic is leading to fewer of these platforms coming up for sale in the first place, as sponsors prefer to hold their assets and continue bolting on smaller businesses.
More Conservative Transaction Structures
The combination of the three previous effects – higher yields, higher interest rate burdens, and lower deal volumes – has changed the way deals are structured. Two headline metrics around which a deal is structured include leverage (the ratio of the borrower’s debt to EBITDA) and LTV (loan-to-value, the ratio of the borrower’s debt to the company’s value). Private equity sponsors are electing to use less leverage on transactions, as higher interest rates mean their portfolio companies cannot bear the interest burden of elevated leverage levels. Equity, therefore, is making up the difference, reducing loan-to-value ratios and providing greater equity cushions for lenders.
The reduction in deal volumes has also led to a gap in dry powder between private equity and private debt funds. Dry powder is the amount of uninvested capital that funds have available to deploy into new opportunities. Today, private equity funds have over US$1Tn of dry powder available, according to a Bain analysis, while Apollo figures indicate private debt dry powder of approximately $400bn[10]. The size of this gap impacts both pricing spreads and deal structures – if there is too much private debt capital chasing private equity deals to lend to, spreads may tighten and deal structures and terms shift in favour of borrowers. If there is far more private equity deal activity and fewer lender dollars to go around, it is lenders who can achieve relatively tighter structures and wider spreads. (Note: since private equity deals tend to use more debt than equity, simply comparing the dollar amount of dry powder isn’t the best way to measure this gap). Thus far in 2024, there has been an element of the former in the market as lenders compete to win deals from sponsors, resulting in tighter pricing year-to-date than in 2023. Still, the impact since the start of the rate-hike cycle has been to the benefit of lenders overall.
Looking Forward – Private Debt in a Declining Rate Environment
As central banks shift to contemplating future rate cuts, rather than hikes, what would a declining rate environment mean for private debt? There are a few likely outcomes. First, headline yields will decline. Just as rising base rates directly contributed to higher yields, so too will they contribute to lower yields. Some private debt investors will be able to offset this decline through a variety of means including moving down-market, moving down the capital stack, or increasing fund-level leverage. Second, coverage metrics will gain some breathing room. With lower interest payments due on debt, private equity-backed companies will be able to operate with more excess cash flow beyond what is required to service their debt. Third, private equity deal volumes should increase - particularly new platform deals - as lower rates unlock LBO activity. Finally, as LBO volumes increase we may yet see a shift towards more lender-friendly pricing and structures as the trend of lenders chasing a lower number of deals eases.
In summary, rising interest rates provided a tailwind for private credit and directly contributed to what’s been called the Golden Age of private debt. Higher yields have generated better returns for investors, while increasingly conservative capital structures maintained the asset class’s defensive positioning in the face of higher interest burdens. When combined with other longer-term trends, including the decline in traditional bank lending, the result has been a fantastic vintage of lending opportunities for investors. The Nicola Private Debt Fund has benefitted from these trends, deploying C$540m of capital into direct lending opportunities in FY 2023 – and thanks to our open-ended, evergreen structure, new investors in the fund are still able to gain exposure to this golden vintage of loans.
Disclaimer
This material contains the current opinions of the author and such opinions are subject to change without notice. This material is distributed for informational purposes only. Forecasts, estimates, and certain information contained herein are based upon proprietary research and should not be considered as investment advice or a recommendation of any particular security, strategy or investment product. All investments contain risk and may gain or lose value. Please speak to your Nicola Wealth advisor for advice based on your unique circumstances. This is not a sales solicitation. This investment is intended for tax residents of Canada who are accredited investors. Residency restrictions apply. Please read the relevant documentation for additional details and important disclosure information, including terms of redemption and limited liquidity. Nicola Wealth Management Ltd. (Nicola Wealth) is registered as a Portfolio Manager, Exempt Market Dealer and Investment Fund Manager with the required securities commissions.
[1] 2024 Preqin Global Report on Private Debt
[2] Federal Reserve Bank of New York – Secured Overnight Financing Rate data
[3] KBRA DLD default rate data, direct lending
[4] Ares – Private Credit: Differentiated Performance in the Midst of Rising Interest Rates
[5] Fitch U.S. Leveraged Loan Default Index
[6] Blackstone – Private Credit, Meet “Higher for Longer”. Data per The Lincoln International Private Market Database
[7] PitchBook, LCD data
[8] Pitchbook – 2023 Annual US PE Breakdown
[9] Pitchbook – 2023 Annual US PE Breakdown
[10] White & Case – Five factors shaping leveraged finance in 2024


